Fourier transform.
#include <complex>
#include <string>
using namespace std;
using namespace TBTK;
using namespace Visualization::MatPlotLib;
void example1D(){
const unsigned int SIZE = 100;
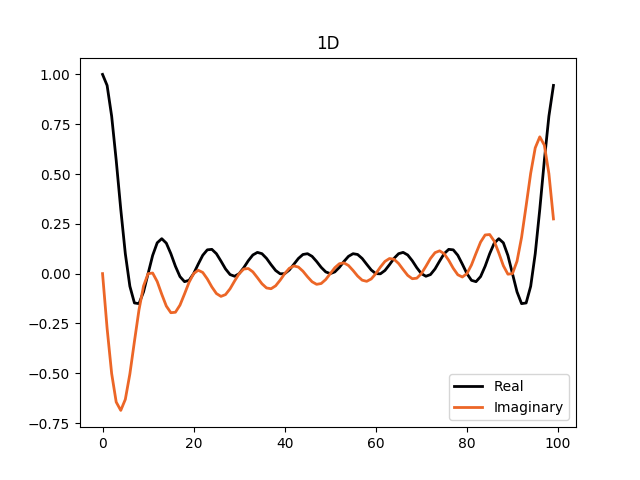
for(unsigned int n = 0; n < SIZE; n++){
if(n < SIZE/10)
input[n] = 1;
else
input[n] = 0;
}
for(unsigned int n = 0; n < SIZE; n++){
outputReal[{n}] =
real(output[n]);
outputImaginary[{n}] =
imag(output[n]);
}
Plotter plotter;
plotter.setTitle("1D");
plotter.plot(outputReal, {{"linewidth", "2"}, {"label", "Real"}});
plotter.plot(
outputImaginary,
{
{"linewidth", "2"},
{"label", "Imaginary"}
}
);
plotter.save("figures/1D.png");
}
void example2D(){
const unsigned int SIZE_X = 100;
const unsigned int SIZE_Y = 100;
for(unsigned int x = 0; x < SIZE_X; x++){
for(unsigned int y = 0; y < SIZE_Y; y++){
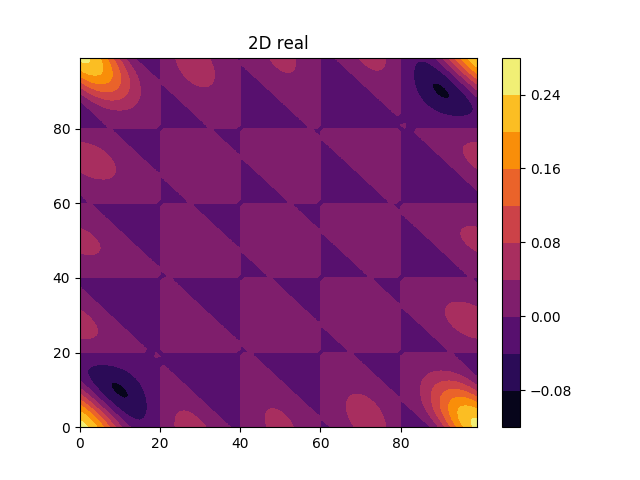
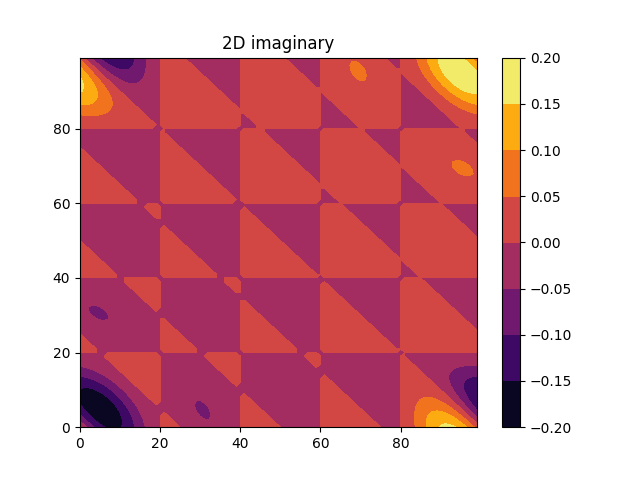
if(x < SIZE_X/20 && y < SIZE_Y/20)
input[{x, y}] = 1;
else
input[{x, y}] = 0;
}
}
input.getData(),
output.getData(),
{SIZE_X, SIZE_Y}
);
for(unsigned int x = 0; x < SIZE_X; x++){
for(unsigned int y = 0; y < SIZE_Y; y++){
outputReal[{x, y}] =
real(output[{x, y}]);
outputImaginary[{x, y}] =
imag(output[{x, y}]);
}
}
Plotter plotter;
plotter.setTitle("2D real");
plotter.plot(outputReal);
plotter.save("figures/2DReal.png");
plotter.clear();
plotter.setTitle("2D imaginary");
plotter.plot(outputImaginary);
plotter.save("figures/2DImaginary.png");
}
void examplePlan(){
const unsigned int SIZE = 100;
input,
output,
{SIZE}
);
Plotter plotter;
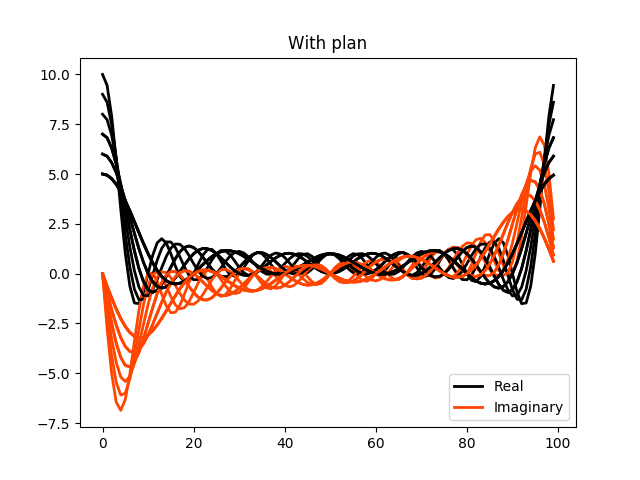
plotter.setTitle("With plan");
for(unsigned int n = 0; n < 10; n++){
for(unsigned int x = 0; x < SIZE; x++){
if(x < SIZE/(n+10))
input[x] = 1;
else
input[x] = 0;
}
for(unsigned int n = 0; n < SIZE; n++){
outputReal[{n}] =
real(output[n]);
outputImaginary[{n}] =
imag(output[n]);
}
if(n == 0){
plotter.plot(
outputReal,
{
{"linewidth", "2"},
{"color", "black"},
{"linestyle", "-"},
{"label", "Real"}
}
);
plotter.plot(
outputImaginary,
{
{"linewidth", "2"},
{"color", "orangered"},
{"linestyle", "-"},
{"label", "Imaginary"}
}
);
}
else{
plotter.plot(
outputReal,
{
{"linewidth", "2"},
{"color", "black"},
{"linestyle", "-"}
}
);
plotter.plot(
outputImaginary,
{
{"linewidth", "2"},
{"color", "orangered"},
{"linestyle", "-"}
}
);
}
}
plotter.save("figures/WithPlan.png");
}
int main(){
example1D();
example2D();
examplePlan();
}


