|
| | Plotter () |
| |
| void | setSize (unsigned int width, unsigned int height) |
| |
| void | setBoundsX (double minX, double maxX) |
| |
| void | setBoundsY (double minY, double maxY) |
| |
| void | setBounds (double minX, double maxX, double minY, double maxY) |
| |
| void | setAxes (const std::vector< std::pair< unsigned int, std::vector< double >> > &axes) |
| |
| void | setTitle (const std::string &title, bool overwrite=true) |
| |
| void | setLabelX (const std::string &labelX, bool overwrite=true) |
| |
| void | setLabelY (const std::string &labelY, bool overwrite=true) |
| |
| void | setLabelZ (const std::string &labelZ, bool overwrite=true) |
| |
| void | plot (const Property::Density &density, const Argument &argument="") |
| |
| void | plot (const Index &pattern, const Property::Density &density, const Argument &argument="") |
| |
| void | plot (const Property::DOS &dos, const Argument &argument="") |
| |
| void | plot (const Property::EigenValues &eigenValues, const Argument &argument="black") |
| |
| void | plot (const Property::LDOS &ldos, const Argument &argument="") |
| |
| void | plot (const Index &pattern, const Property::LDOS &ldos, const Argument &argument="") |
| |
| void | plot (const Vector3d &direction, const Property::Magnetization &magnetization, const Argument &argument="") |
| |
| void | plot (const Index &pattern, const Vector3d &direction, const Property::Magnetization &magnetization, const Argument &argument="") |
| |
| void | plot (const Vector3d &direction, const Property::SpinPolarizedLDOS &spinPolarizedLDOS, const Argument &argument="") |
| |
| void | plot (const Index &pattern, const Vector3d &direction, const Property::SpinPolarizedLDOS &spinPolarizedLDOS, const Argument &argument="") |
| |
| void | plot (unsigned int state, const Property::WaveFunctions &waveFunctions, const Argument &argument="") |
| |
| void | plot (const Index &pattern, unsigned int state, const Property::WaveFunctions &waveFunctions, const Argument &argument="") |
| |
| void | plot (const AnnotatedArray< double, double > &data, const Argument &argument="") |
| |
| void | plot (const AnnotatedArray< double, Subindex > &data, const Argument &argument="") |
| |
| void | plot (const Array< double > &data, const Argument &argument="") |
| |
| void | plot (Array< double > x, const Array< double > &y, const Argument &argument="") |
| |
| void | plot (Array< double > x, Array< double > y, const Array< double > &z, const Argument &argument="") |
| |
| void | setPlotMethod3D (const std::string &plotMethod3D) |
| |
| void | setRotation (int elevation, int azimuthal, bool overwrite=true) |
| |
| void | setNumContours (unsigned int numContours) |
| |
| void | clear () |
| |
| void | show () const |
| |
| void | save (const std::string &filename) const |
| |
|
These functions resolves otherwise ambiguous function calls.
|
|
void | plot (const Array< double > &data, const std::initializer_list< std::pair< std::string, std::string > > &argument) |
| |
|
void | plot (const std::initializer_list< double > &data, const Argument &argument="") |
| |
|
void | plot (const std::initializer_list< double > &x, const Array< double > &y, const Argument &argument="") |
| |
|
void | plot (const Array< double > &x, const std::initializer_list< double > &y, const Argument &argument="") |
| |
|
void | plot (const std::initializer_list< double > &x, const std::initializer_list< double > &y, const Argument &argument="") |
| |
Plots data.
The Plotter can plot Properties, Arrays, AnnotatedArrays, and other types that are automatically convertable to these types.
Matplotlib as backend
The plotter uses matplotlib as backend and therefore requires python with matplotlib to be installed to be possible to use. While the Plotter does not give direct access to matplotlib, it does allow for a subset of plot customization to be done through plot arguments. Each plot function takes an optional list of key-value pairs that will be passed on to the corresponding matplotlib function. For example, it is possible to set the line width and color as follows.
plotter.plot(data, {{"linewidth", "2"}, {"color", "red"}});
It is important to note that the Plotter switches between different matplotlib routines to plot different types of data. The possible key-value pairs depends on which routine is used by the plotter. By default, the Plotter uses the function matplotlib.pyplot.plot for 1D data and matplotlib.pyplot.contourf for 2D data.
2D plots
By default 2D data is plotted using matplotlib.pyplot.contourf, but it is also possible to use mpl_toolkit.mplot3d.axes3d.Axes3D.plot_surface. The function that is used can be set using
plotter.setPlotMethod3D("plot_surface");
or
plotter.setPlotMethod3D("contourf");
Number of contours for contourf
When using contourf, the number of contour levels can be set using
plotter.setNumContours(20);
Rotation for plot_surface
When using plot_surface, the rotation can be set using
plotter.setRotation(elevation, azimuthal);
where elevation and azimuthal have the type int.
Title and labels
To set the title and labels, use
plotter.setTitle("My title");
plotter.setLabelX("z-axis");
plotter.setLabelY("y-axis");
plotter.setLabelZ("z-axis");
Modifying axes
Bounds
By default axes are rescaled to fit the data. The bounds for a given axis can be changed by calling
plotter.setBoundsX(minX, minY);
plotter.setBoundsY(minY, minY);
or
plotter.setBounds(minX, maxX, minY, maxY);
Ticks
By default the ticks run from 0 to N-1, where N is the number of data points for the given axis. If the data contans additional information, that allows the tick values to be modified automatically, the Plotter will do so.
For example, EnergyResolvedProperties such as the DOS will have their ticks running between the energy range's lower and upper bound. Similarly, a Property with an Index structure such as {x, y, z}, where x runs from minX to maxX, will have its tick values for the x-axis run from minX to maxX.
It is possible to override this behavior as follows.
plotter.setAxes({
{0, {lowerBound, upperBound}},
{1, {tick0, tick1, tick2}}
});
Here the first line says that the tick values for the first axis should be replaced by uniformly spaced tick values ranging from lowerBound to upperBound. The second line says that the tick values for the second axis should be replaced by tick0, tick1, and tick2. When using the second format, it is important that the number of supplied tick values is the same as the size of the range of the data along that axis. The list of axes supplied to setAxes does not need to be complete and the default behavior will be applied to all axes that are not in the list.
Properties
Properties can have one of three different formats:
- IndexDescriptor::Format::None
- IndexDescriptor::Format::Ranges
- IndexDescriptor::Format::Custom
The syntax for plotting these differs slightly.
None and Ranges
Properties on the None and Ranges can be plotted using the syntax
plotter.plot(property, optionalKeyValuePairs);
where property is a Property and optionalKeyValuePairs is an optional list of key-value pairs as described in the matplotlib section above.
Custom
Properties on the Custom format does not have an explicit structural layout. The Plotter therefore need an additional pattern Index to determine how to plot the data. If, for example, the Property has the Index structure {x, y, z}, it can be plotted for the y=5 plane using
plotter.plot({_a_, 5, _a_}, property, optionalKeyValuePairs);
The number of wildcard falgs *_a_* determines the dimensionallity of the output (plus an additional dimension if the Property has a block structure. All data points satisfying the given pattern will be organized into a grid like structure, and for possible missing data points in this grid, the value will be assumed to be zero.
Example
#include "TBTK/PropertyExtractor/Diagonalizer.h"
using namespace std;
using namespace TBTK;
using namespace Visualization::MatPlotLib;
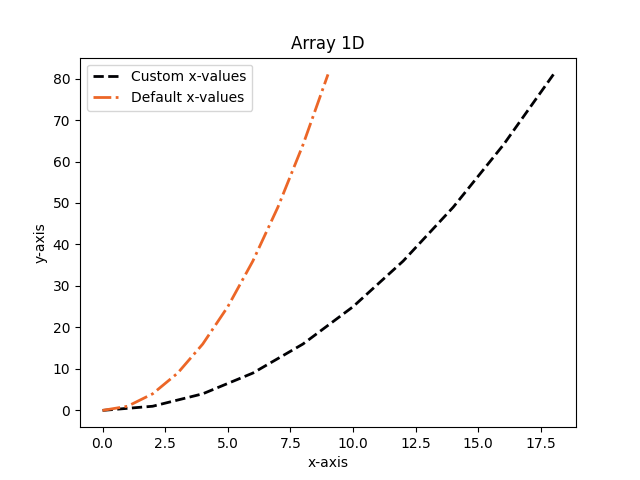
void plotArray1D(){
const unsigned int SIZE = 10;
for(unsigned int n = 0; n < SIZE; n++){
x[{n}] = 2*n;
y[{n}] = n*n;
}
plotter.setTitle("Array 1D");
plotter.setLabelX("x-axis");
plotter.setLabelY("y-axis");
plotter.plot(
x,
y,
{
{"linewidth", "2"},
{"linestyle", "--"},
{"label", "Custom x-values"}
}
);
plotter.plot(
y,
{
{"linewidth", "2"},
{"linestyle", "-."},
{"label", "Default x-values"}
}
);
plotter.save("figures/Array1D.png");
}
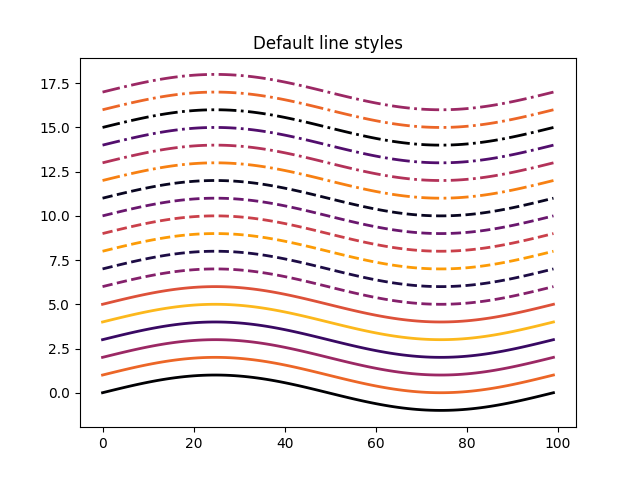
void plotDefaultLineStyles(){
const unsigned int SIZE = 100;
plotter.setTitle("Default line styles");
for(unsigned int n = 0; n < 18; n++){
Range range(0, 2*M_PI, SIZE);
y[{c}] = n +
sin(range[c]);
plotter.plot(y);
}
plotter.save("figures/DefaultLineStyles.png");
}
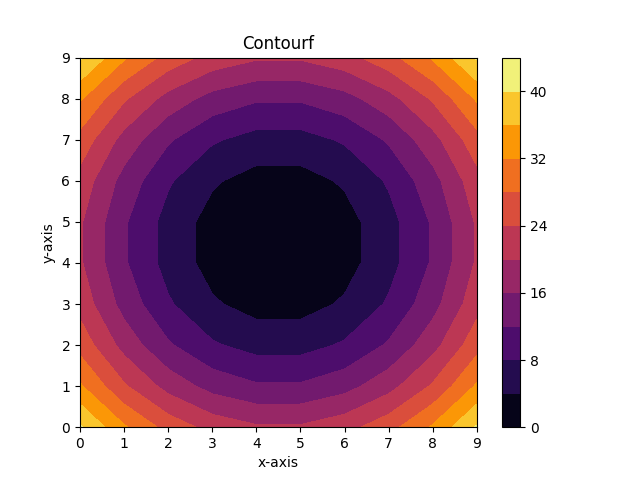
void plotArray2D(){
const unsigned int SIZE_X = 10;
const unsigned int SIZE_Y = 10;
for(unsigned int X = 0; X < SIZE_X; X++){
for(unsigned int Y = 0; Y < SIZE_Y; Y++){
x[{X, Y}] = X;
y[{X, Y}] = Y;
z[{X, Y}] =
pow(X - 4.5, 2) +
pow(Y - 4.5, 2);
}
}
plotter.setNumContours(10);
plotter.setTitle("Contourf");
plotter.setLabelX("x-axis");
plotter.setLabelY("y-axis");
plotter.plot(x, y, z);
plotter.save("figures/Contourf.png");
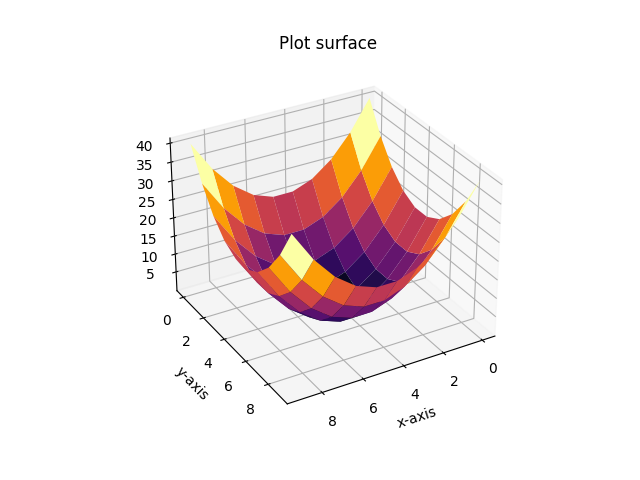
plotter.clear();
plotter.setPlotMethod3D("plot_surface");
plotter.setTitle("Plot surface");
plotter.setLabelX("x-axis");
plotter.setLabelY("y-axis");
plotter.setLabelZ("z-axis");
plotter.setRotation(30, 60);
plotter.plot(x, y, z);
plotter.save("figures/PlotSurface.png");
}
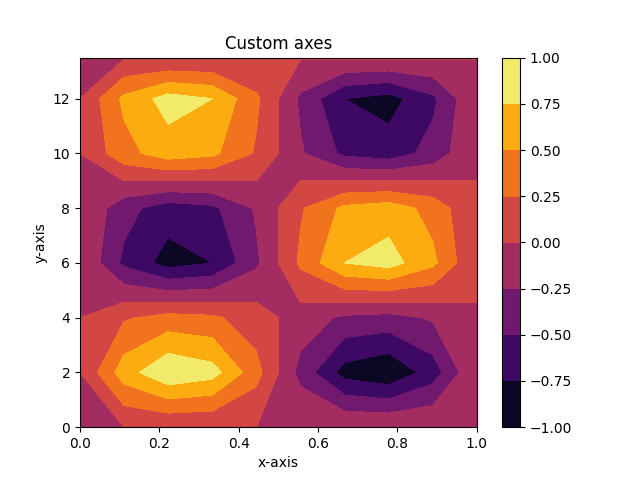
void plotCustomAxes(){
const unsigned int SIZE_X = 10;
const unsigned int SIZE_Y = 10;
Range kx(0, 2*M_PI, SIZE_X);
Range ky(0, 4*M_PI, SIZE_Y);
for(unsigned int X = 0; X < SIZE_X; X++){
for(unsigned int Y = 0; Y < SIZE_Y; Y++){
x[{X, Y}] = X;
y[{X, Y}] = Y;
z[{X, Y}] =
sin(kx[X])*
sin(ky[Y]);
}
}
plotter.setTitle("Custom axes");
plotter.setLabelX("x-axis");
plotter.setLabelY("y-axis");
plotter.setAxes({
{0, {0, 1}},
{1, {0, 2, 4, 6, 8, 10, 12, 14, 16, 18}}
});
plotter.setBoundsX(0, 1);
plotter.setBoundsY(0, 13.5);
plotter.plot(x, y, z);
plotter.save("figures/CustomAxes.png");
}
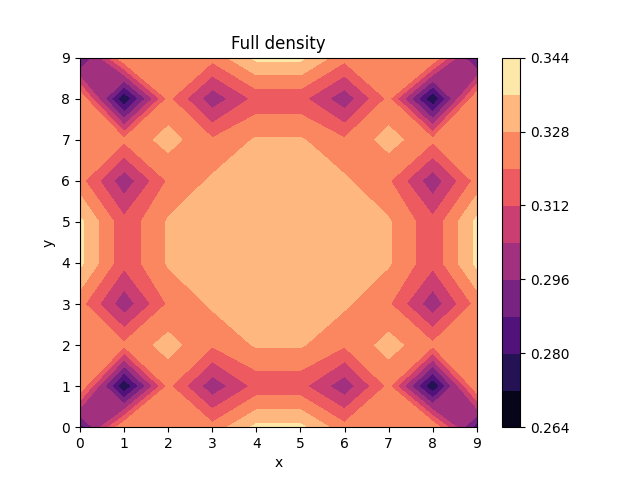
void plotDensity(){
const unsigned int SIZE_X = 10;
const unsigned int SIZE_Y = 10;
double t = 1;
plotter.setTitle("Full density");
plotter.plot({_a_, _a_}, density, {{"cmap", "magma"}});
plotter.save("figures/FullDensity.png");
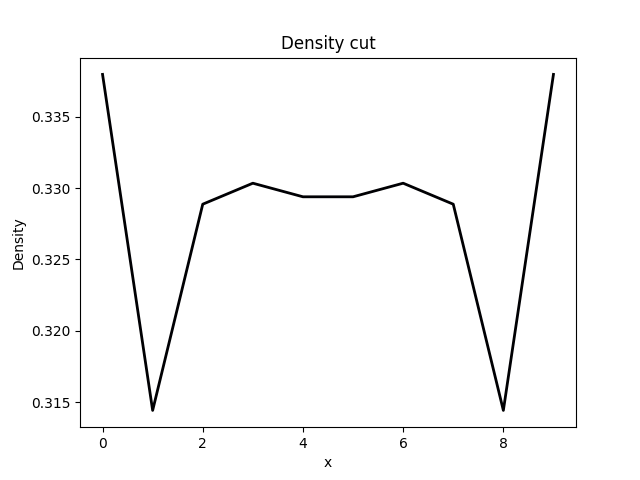
plotter.clear();
plotter.setTitle("Density cut");
plotter.plot({_a_, SIZE_Y/2}, density, {{"linewidth", "2"}});
plotter.save("figures/DensityCut.png");
}
int main(){
plotArray1D();
plotDefaultLineStyles();
plotArray2D();
plotCustomAxes();
plotDensity();
}
Output


 1.8.17